Types of reports
FlopHero's Reports section is where you move from reviewing individual sessions to understanding your long-term patterns. Instead of looking at one session at a time, reports aggregate all your hands and break them down by specific criteria like position, stack depth, or number of players at the table. This lets you spot recurring leaks and see exactly where you're losing the most EV.
Each report type filters your entire hand database differently, giving you a unique lens to analyze your play. You can combine any report with powerful filters to drill down even further. Let's walk through the main report types and how to use them.
Understanding the data format
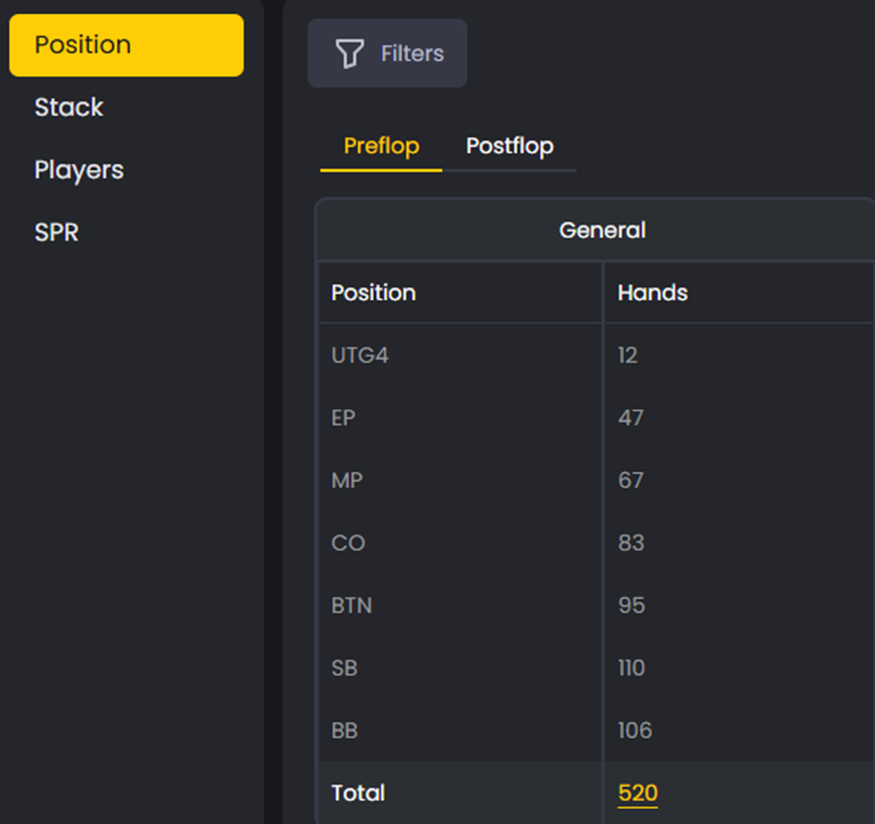
Before we dive into report types, you need to understand how FlopHero displays your mistakes. When you see 2 (35) in a report, this means you made 2 mistakes out of 35 opportunities in that specific spot. The first number is your error count, and the number in parentheses is how many times you faced that decision.
This format lets you quickly identify not just where you're making mistakes, but also which spots you encounter most frequently. A spot with 10 (15) errors is more urgent to fix than one with 2 (3), even though the error rate is similar, because you're bleeding more total EV in the high-frequency spot.
Preflop vs Postflop tabs
All reports have two tabs: Preflop and Postflop. These tabs show completely different data structures because preflop and postflop decisions are fundamentally different.
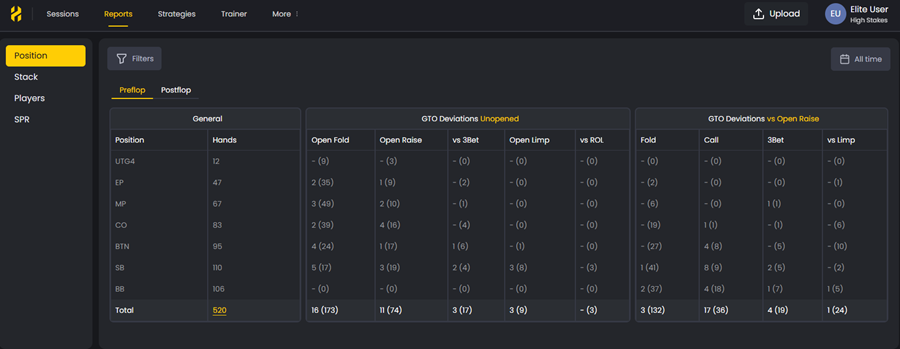
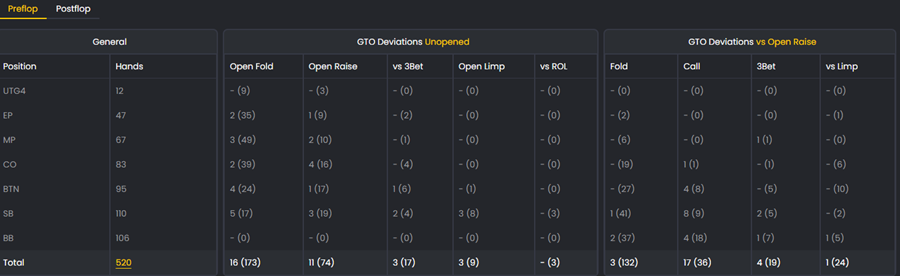
The Preflop tab shows two main categories: Unopened (when action folds to you) and vs Open Raise (when someone opens before you). Each category breaks down into specific actions like Open Fold, Open Raise, vs 3Bet, Open Limp, vs ROL, Fold, Call, 3Bet, and vs Limp.
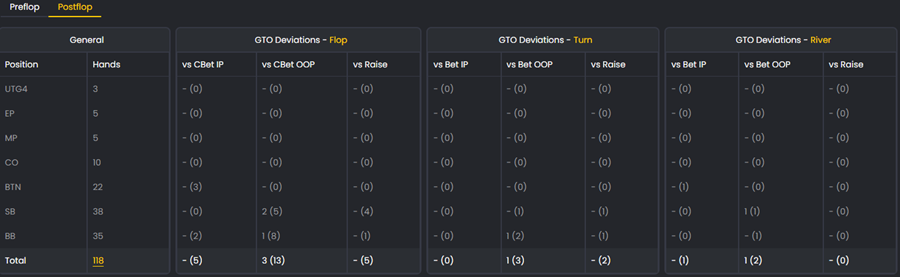
The Postflop tab organizes data by street (Flop, Turn, River) and shows your deviations based on facing different actions. For example, on the flop you'll see columns like vs CBet IP (facing a continuation bet in position), vs CBet OOP (facing a cbet out of position), and vs Raise. The turn and river have similar breakdowns: vs Bet IP, vs Bet OOP, and vs Raise.
Preflop reports
Preflop reports show your performance organized by preflop situation: single-raised pots (SRP), 3-bet pots (3BP), and 4-bet pots (4BP). This is where you identify structural leaks in your preflop strategy.
Questions to study:
- Are you calling too many 3-bets out of position?
- Are you missing profitable 4-bet opportunities?
- Are you overfolding to 3-bets from the button?
- Are you opening too tight or too loose from certain positions?
Preflop reports expose these leaks so you can refine your opening ranges, 3-bet frequencies, and responses to aggression. Since preflop decisions set up every postflop situation, fixing leaks here has a massive downstream impact on your win rate.
Postflop reports
Postflop reports are the most detailed report type. They analyze your performance by action type on each street: flop, turn, and river. You can see exactly how you're performing when you bet, check, call, raise, or fold on any street.
This is where you find the deepest insights into your in-hand decision quality. Are you check-raising the flop too frequently? Folding too much to river bets? Missing thin value spots on the turn? Postflop reports answer all of these questions.
What to analyze:
- Check-raise frequency on each street
- Folding frequency to bets and raises
- Value betting patterns (are you betting thin enough?)
- Bluffing frequency and timing
Because postflop reports are so granular, they're best used after you've identified a general leak in another report type. For example, if your Position report shows you're losing from the button, use a Postflop report filtered for button hands to see exactly which streets and actions are causing the problem.
Position reports
Position reports show your performance from each seat at the table: UTG, EP, MP, CO, BTN, SB, and BB. This is one of the most revealing report types because position has such a massive impact on your expected win rate.
When you open a position report, you'll see your GTO Deviations organized by position. Each cell shows your mistakes in the format errors (opportunities), making it easy to spot both high-error-rate spots and high-frequency leaks.
Common leaks to look for:
- Losing too much from the blinds (overfolding or overcalling)
- Underperforming from the button (not stealing enough or missing value)
- Opening too tight from early position
Click on any position to filter the Handlist below and review all hands from that seat. Sort by GTO ΔEV to find your most expensive mistakes.
Stack size reports
Stack size reports organize your hands by effective stack depth - the smallest stack between you and your opponent in a given hand. This is critical because optimal strategy changes dramatically as stacks get shallower or deeper.
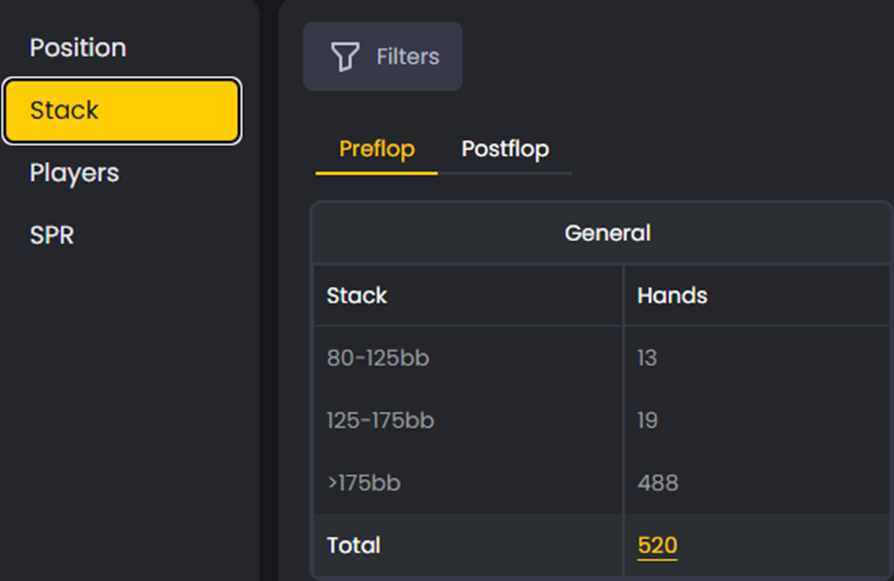
If you're crushing at 100bb but bleeding chips at 40bb, this report will show it immediately. Many players have a "comfort zone" stack depth where they play well, and struggle outside of it. Stack size reports expose that gap.
Common patterns:
- Strong results at 100bb but weak play at 40bb or below
- Overfolding in deep-stack situations (150bb+)
- Playing too loose when short-stacked
Use EV Loss % and GTO ΔEV to see where your performance shifts by depth, then study those hands in the GTO Replayer to understand what adjustments you're missing.
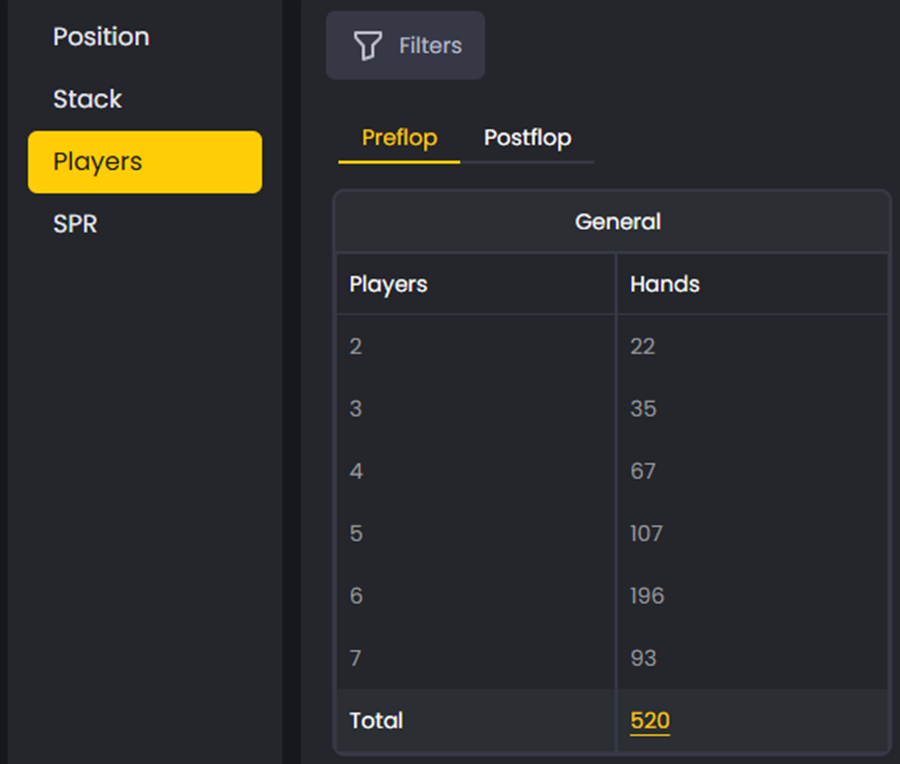
Players reports
Players reports filter your hands based on the number of players at the table when the hand was dealt. This helps you understand whether your strategy adapts properly to different table sizes, from 2-handed (heads-up) all the way to full ring (10 players).
Table size dramatically affects your opening ranges, stealing opportunities, and blind defense frequencies. If you're profitable at 6-max but struggling at full ring, this report will highlight the difference. The same applies if you play well at full tables but make mistakes in short-handed situations.
What to look for:
- Strong performance at 6-max but poor results at full ring
- Opening too tight or too loose as table size changes
- Failing to adjust blind defense frequency based on table size
If you spot a leak here, filter your hands by player count and study them in the Replayer. Focus on understanding how your ranges should tighten or loosen as the table fills up or empties out.
SPR reports
SPR (Stack-to-Pot Ratio) reports evaluate your performance based on the ratio of your effective stack to the pot size on the flop. SPR is calculated as: Effective Stack ÷ Pot Size.
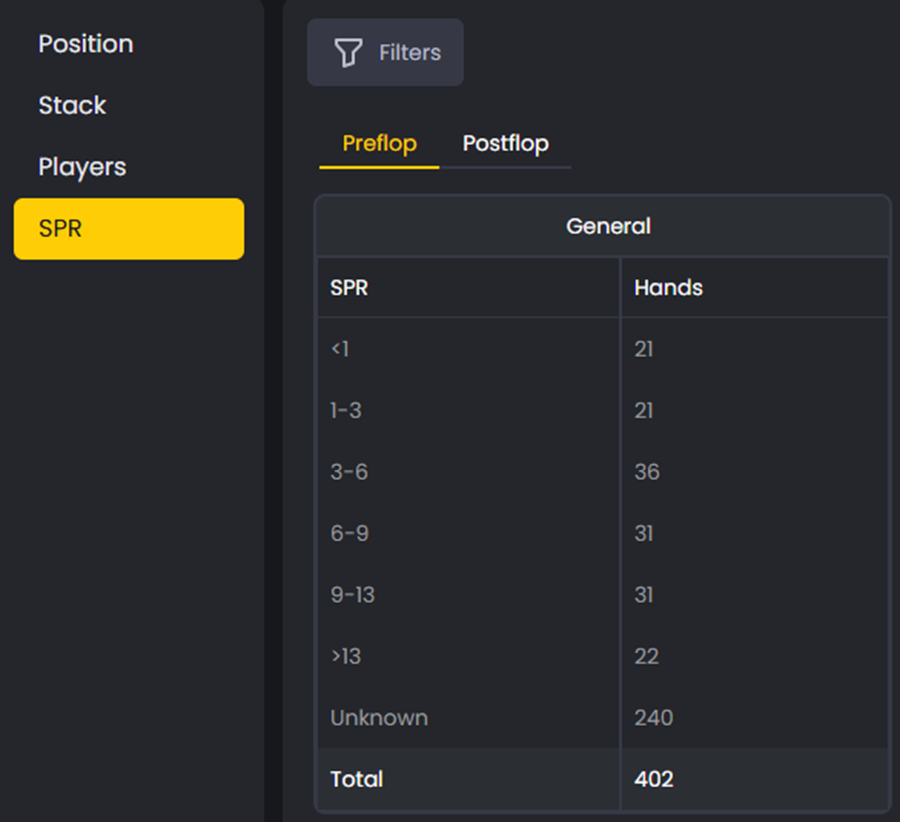
For example, if the pot is $10 and you have $50 behind, your SPR is 5. SPR dictates how aggressive or cautious you should be postflop:
- Low SPR (<3): Favors aggressive lines, committing with strong hands
- Medium SPR (3-10): Requires balanced play and careful pot control
- High SPR (>10): Demands caution, balance, and precise range construction
SPR reports help you locate errors in your postflop aggression or passivity. If you're overcommitting in high SPR spots or playing too cautiously in low SPR situations, this report will show it. Track your improvement over time in the Statistics section.
Using filters to drill down
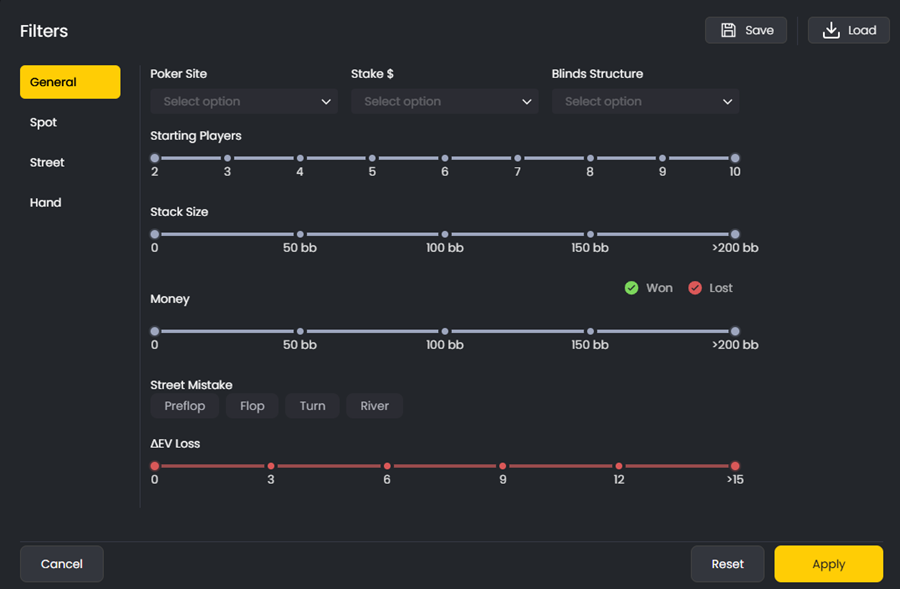
The real power of reports comes from combining them with FlopHero's advanced filter system. The Filters button opens a modal with four tabs: General, Spot, Street, and Hand. Each tab gives you precise control over which hands appear in your report.
The General tab lets you filter by poker site, stake level, blinds structure, starting players (2-10), stack size (0-200bb), money won or lost, street where mistakes occurred (preflop/flop/turn/river), and total ΔEV loss (0-15). This is where you narrow down your sample to specific game conditions.
The Spot tab is incredibly powerful. You can filter by spot postflop (SRP 2Players, 3Bet 2Players, 4Bet 2Players, Squeeze, Limped Pot, Multiway, etc.), hero position (UTG1-4, EP, MP, CO, BTN, SB, BB), villain position, and relative position (IP/OOP). This lets you isolate specific scenarios like "all 3-bet pots where I'm out of position against a CO open."
The Street tab lets you filter by board texture. You can specify top/middle/bottom card, suitedness (rainbow, 2-suited, 3-suited), pair on board (no pair, top pair, bottom pair, trips), relative position, straight made/draw possible, SPR range (1-20), and starting players. This is perfect for studying how you perform on specific board types.
The Hand tab shows a complete grid of all Omaha starting hands. You can filter by suited type (single, double, triple, 4S|Rainbow) and select specific hand combinations like AA, AKt, AQt, etc. This lets you analyze your performance with specific hand types to see if you're overvaluing or undervaluing certain holdings.
You can Save your filter combinations and Load them later, making it easy to return to specific analysis views. For example, you might save a filter for "3-bet pots OOP with high SPR" if that's a recurring leak you're working on.
Combining reports and filters
Here's where it all comes together. You can layer any report type with any combination of filters to create extremely precise analysis views. For example, you could study all 3-bet pots (Spot filter), out of position (Spot filter), with high SPR (Street filter), on a paired board on the turn (Street filter), using a Postflop report.
This layered approach helps you uncover subtle, expensive leaks that would be invisible in a broader view. Once you've filtered down to a specific spot, you can open any hand directly in the GTO Replayer to compare your decisions against the solver's recommendations and understand the logic behind optimal play.
To learn advanced filtering techniques and how to structure your review sessions around reports, see Getting the Most from Reports.
How to use reports in your study routine
Start with the Session Dashboard to identify which sessions have the highest GTO ΔEV. Once you've reviewed a few sessions, move to reports to see if patterns emerge.
A good workflow:
- Check Position reports to see which seats are leaking
- Use Preflop reports to identify structural preflop leaks
- Drill down with Postflop reports to find specific street-by-street mistakes
- Apply filters to isolate the exact spots you want to study
- Open hands in the GTO Replayer and study the solver's logic
Reports turn raw data into actionable insights. Instead of guessing where you're losing money, you'll know exactly which spots to focus on. For more on interpreting the metrics you'll see in reports, check out Statistics.
Was this article helpful?
Still need help?
Join our community
Get instant support from experts and fellow players
Join Discord Community