Statistics
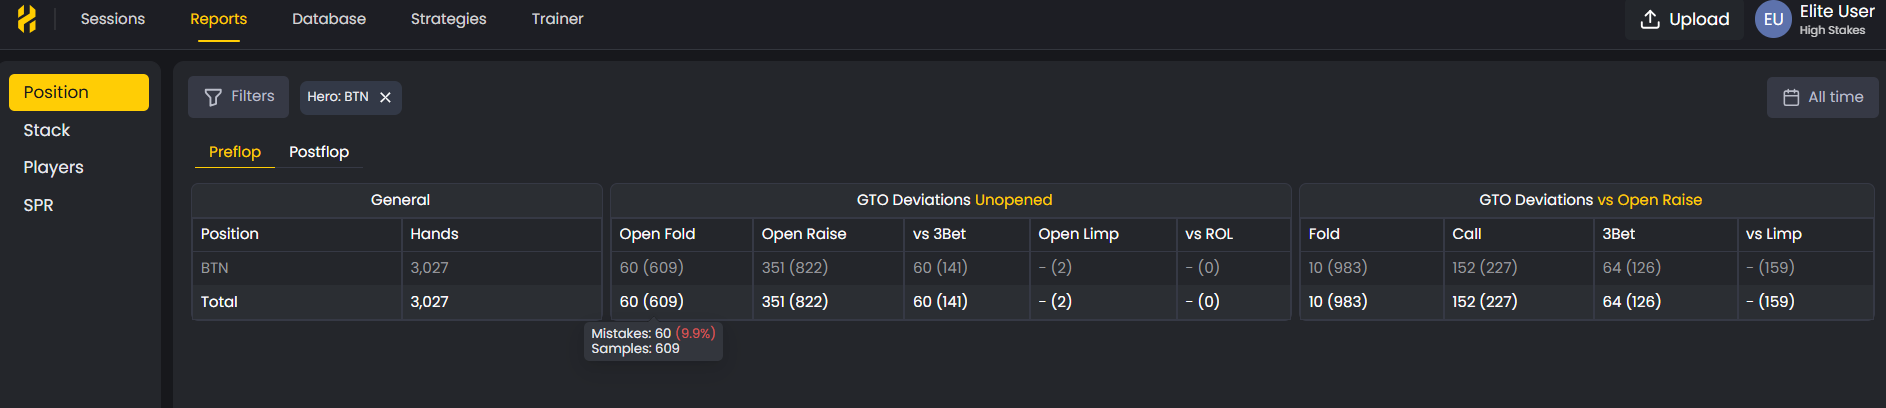
The Statistics Dashboard in the Reports section shows your action frequencies and tendencies across different poker scenarios. It helps you compare how often you take certain actions against GTO benchmarks, making it easier to spot exploitable patterns and fix leaks.
The Statistics Dashboard tracks your action frequencies against GTO standards to identify leaks and patterns.
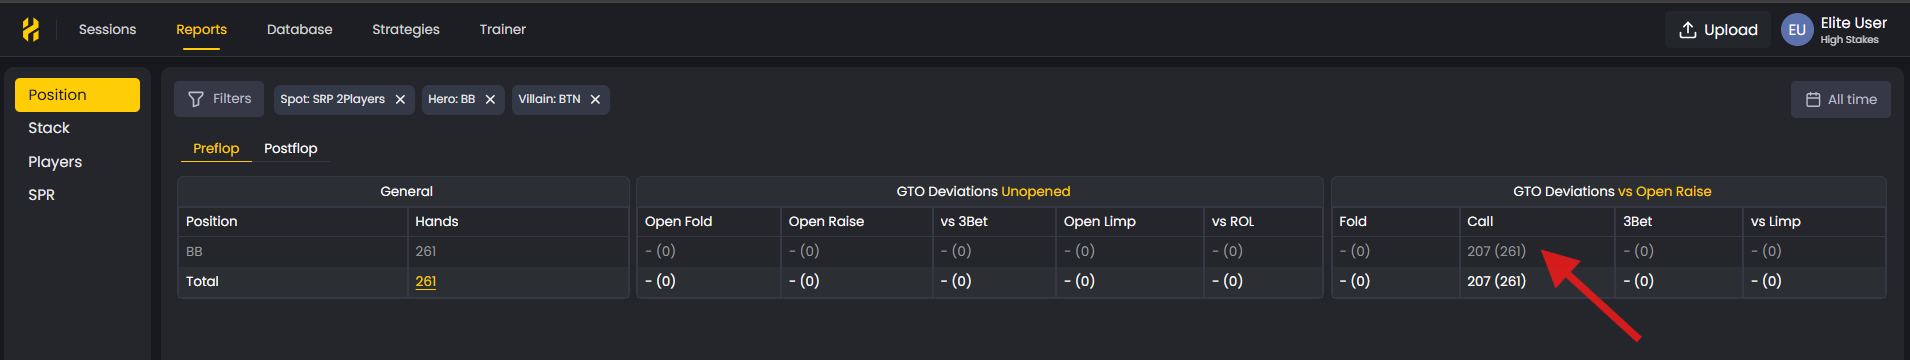
How to Use the Dashboards
The dashboard organizes data by position and preflop action.
You can select specific scenarios - like defending the big blind against a button open - to see your stats in that exact spot.
A table displays:
- Your action frequencies (fold, call, 3-bet, etc.)
- GTO frequencies for the same spot
The side-by-side layout shows where your tendencies deviate from solver recommendations.
Understanding Frequencies
The Frequency column shows how often you took a specific action in the chosen scenario.
Example: if your 3-bet frequency is 15%, you 3-bet 15% of the time in that spot.
Compare your stats to the GTO column:
- If GTO 3-bets 10% and you 3-bet 20%, you may be over-aggressive.
- If GTO folds 50% and you fold 70%, you may be too passive.
To see the EV impact of these tendencies, check EV Loss % and ΔEV metrics.
Frequency columns show how often you take certain actions compared to GTO benchmarks to reveal over- or under-aggression.
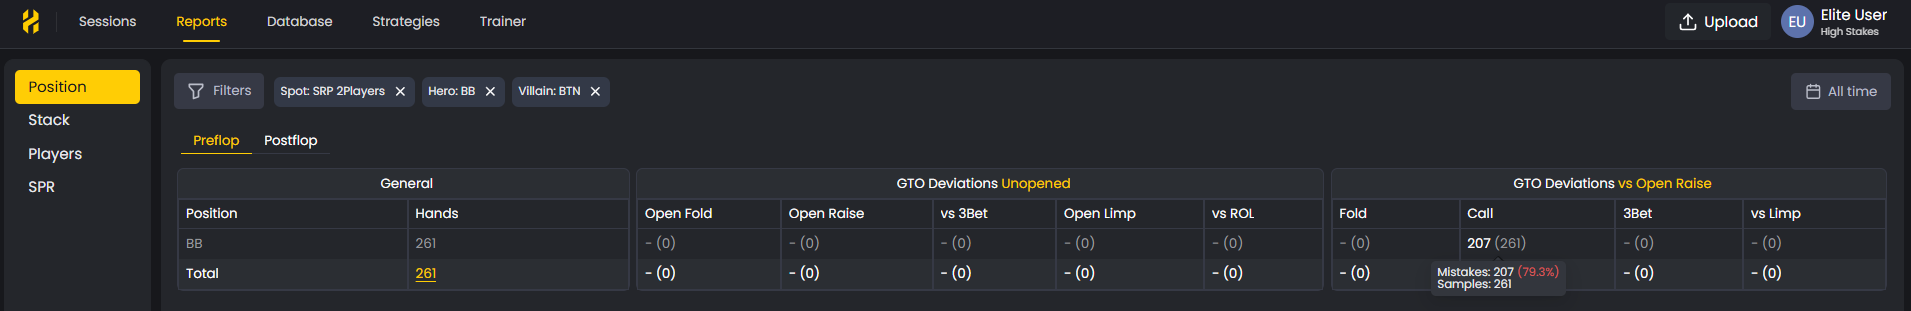
What the Number in Parentheses Means
Each frequency includes a number in parentheses representing the sample size - how many hands fit the selected scenario.
A stat from 1,000 hands is more reliable than one from 10.
Use this to prioritize which tendencies are statistically meaningful.
Numbers in parentheses represent the sample size for each stat, indicating how reliable the frequency data is.
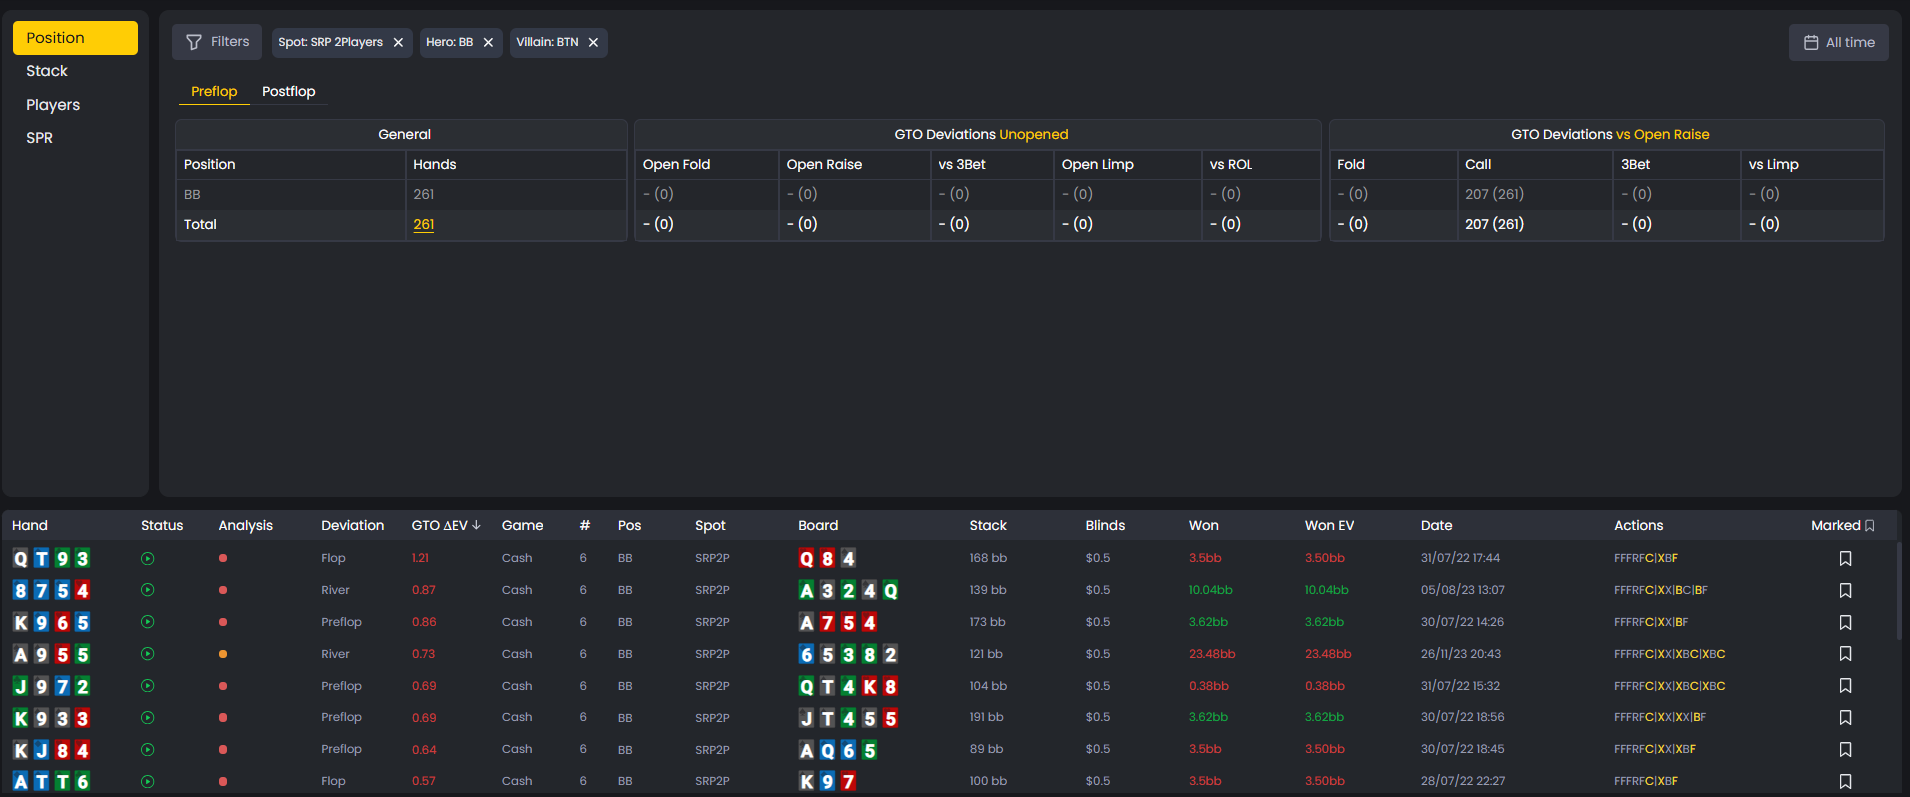
Clicking to Filter Hands
Every stat is clickable. Selecting one updates the Handlist below to show only the hands where you took that action in that spot.
This lets you connect numbers to real hands.
If your 3-bet frequency seems too high, click it to view those specific hands and review them in the Replayer to identify errors.
Click any statistic to filter the Handlist and review all related hands directly in the Replayer for detailed analysis.
Finding Exploitable Patterns
The Statistics Dashboard highlights strategic imbalances that opponents can exploit.
Common examples:
- Folding too much to 3-bets
- Not continuation-betting enough on the flop
- Over-bluffing in specific positions
Regularly review your frequencies to check for these patterns.
Compare them to GTO and investigate the related hands using Decision Analysis to see optimal alternatives.
Use frequency data to uncover exploitable patterns such as overfolding or missed continuation bets and adjust accordingly.
Tracking Your Progress
Use the dashboard over time to track how your play evolves.
- Are your frequencies aligning more closely with GTO?
- Are your biggest leaks shrinking?
The dashboard turns raw data into measurable progress.
Combine it with Blunders, Mistakes, and Missed Value reports to see which areas have improved most.
Was this article helpful?
Still need help?
Join our community
Get instant support from experts and fellow players
Join Discord Community