Understanding Your First Analysis
After uploading your first session, you’ll see metrics that show how your play compares to GTO strategy. This guide explains what you’re looking at and where to start.
Sessions page metrics
Your uploaded session appears in the Sessions page with key numbers in the top table.
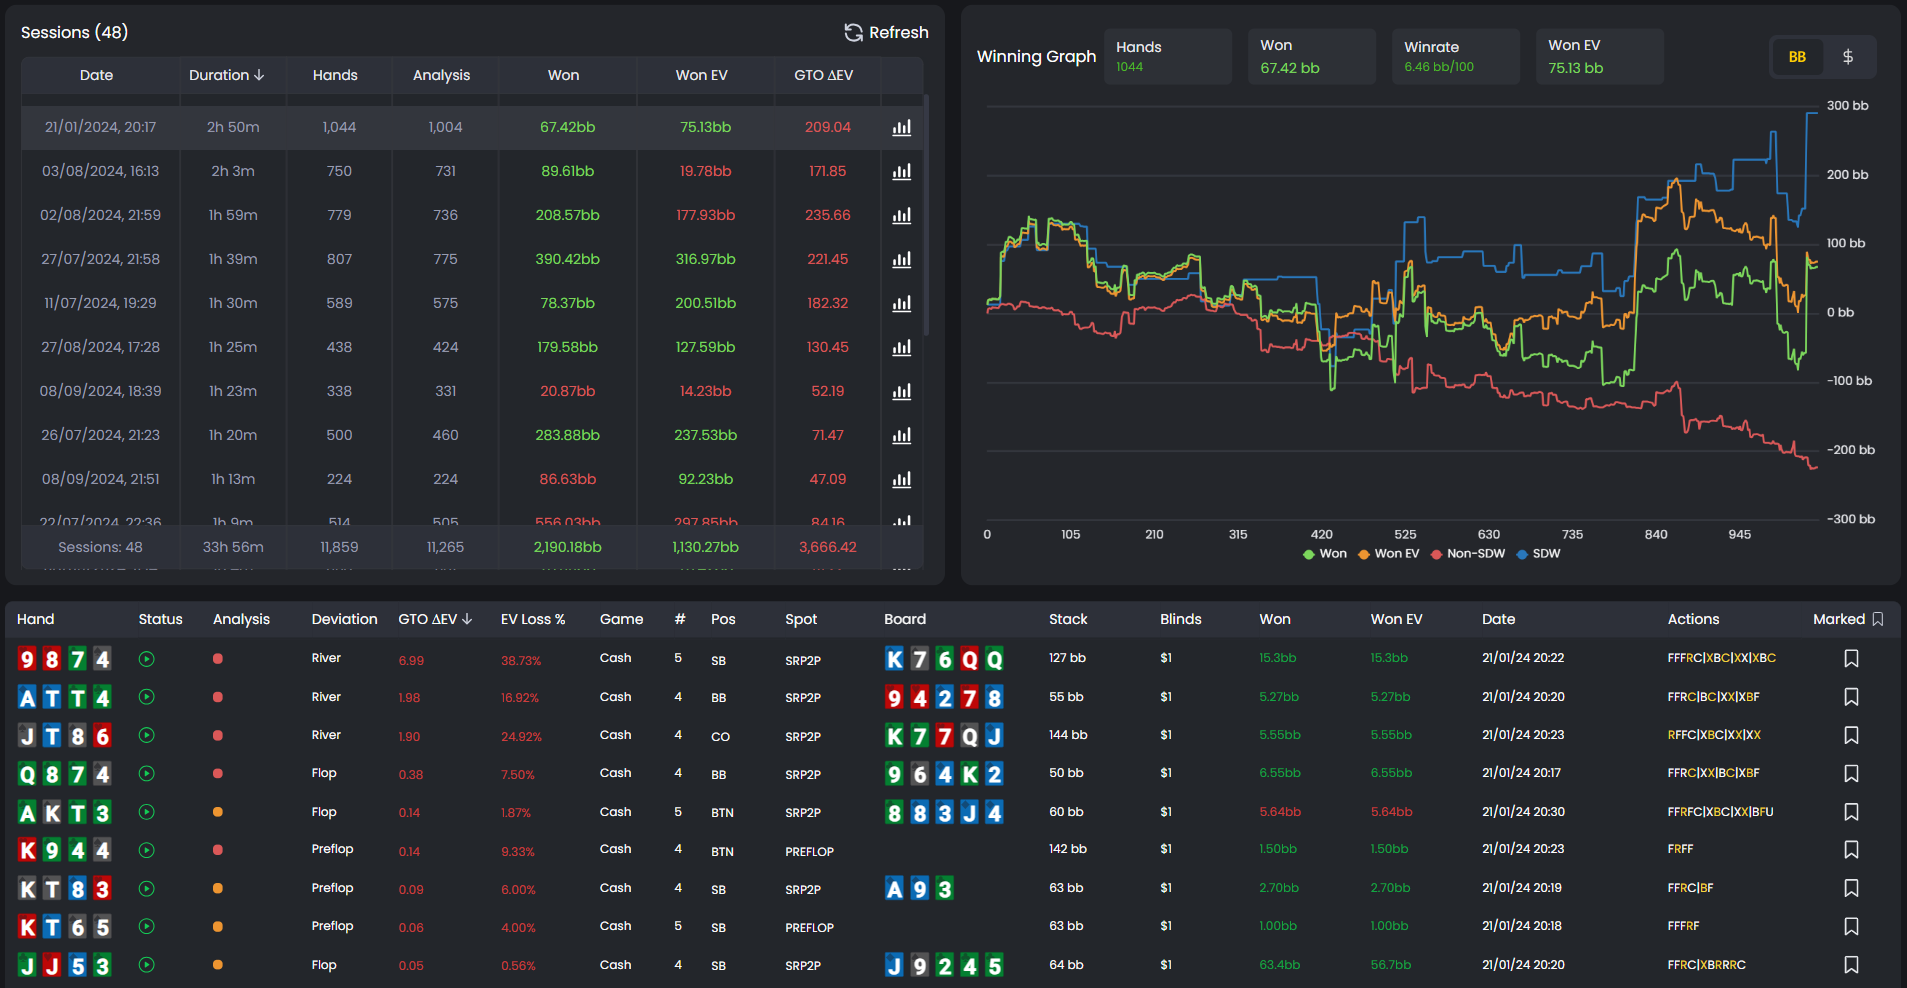
Won: Shows how much you actually won or lost in big blinds.
Won: Shows the exact value you won or lost on that session.
Won EV: Shows your expected value based on the equity of your decisions.
GTO ΔEV is the most important number. If it’s 50bb, you made mistakes that cost you 50 big blinds of expected value. Lower is better. Zero means perfect GTO play (which never happens).
The difference between Won and Won EV tells you if you got lucky or unlucky. If you won 100bb but your Won EV is 50bb, you ran hot. If you won 50bb but your Won EV is 100bb, you ran cold.
Winning graph
On the right side of the Sessions page, you’ll see a graph tracking your performance over time.
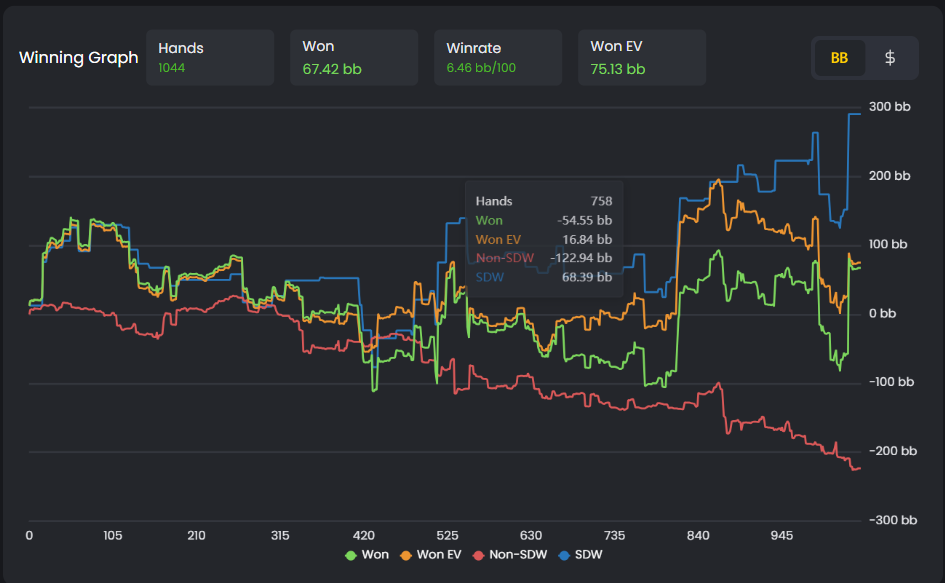
The graph displays four key metrics of your performance:
Green (Won): your actual winnings.
Orange (Won EV): your expected value based on GTO decisions.
Blue (SDW): winnings from hands that went to showdown.
Red (Non-SDW): winnings from hands that ended before showdown.
When the green line is above the orange line, you’re running hot (winning more than expected). When it’s below, you’re running cold (running under EV). The distance between the two represents variance.
The blue and red lines reveal how you’re making money.
A rising blue line means you’re winning at showdown - strong hands and solid value bets.
A rising red line means you’re taking down pots without showdown - through folds, bluffs, and pressure.
A balanced, healthy graph usually shows both trending upward.
If the red line is flat or falling, you’re not winning enough without showdown - often a sign of low aggression or poorly timed bluffs.
Hand list and decision quality
Below the session summary, you’ll see individual hands with two important indicators: a status icon and a decision quality marker.
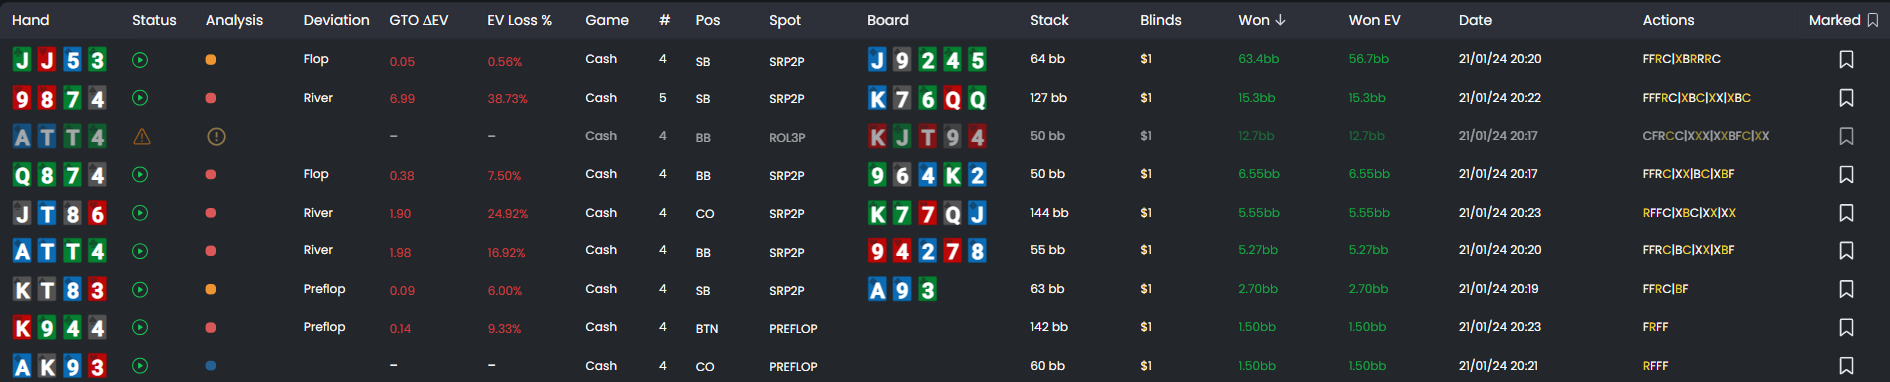
The status icon (clock or triangle) tells you if GTO analysis is available. Once analyzed, each hand shows a colored circle indicating decision quality: Red (Blunder), Orange (Weak), or Blue (Optimal). You can learn more about these in our Decision quality categories article.
The Deviation column shows where the deviation on your play occurred compared to the GTO solution.
Click any hand to open the GTO Replayer and see exactly what happened.
GTO Replayer
The GTO Replayer shows a poker table with your hand and your opponent’s hand. You’ll see stack sizes, positions, and the pot.
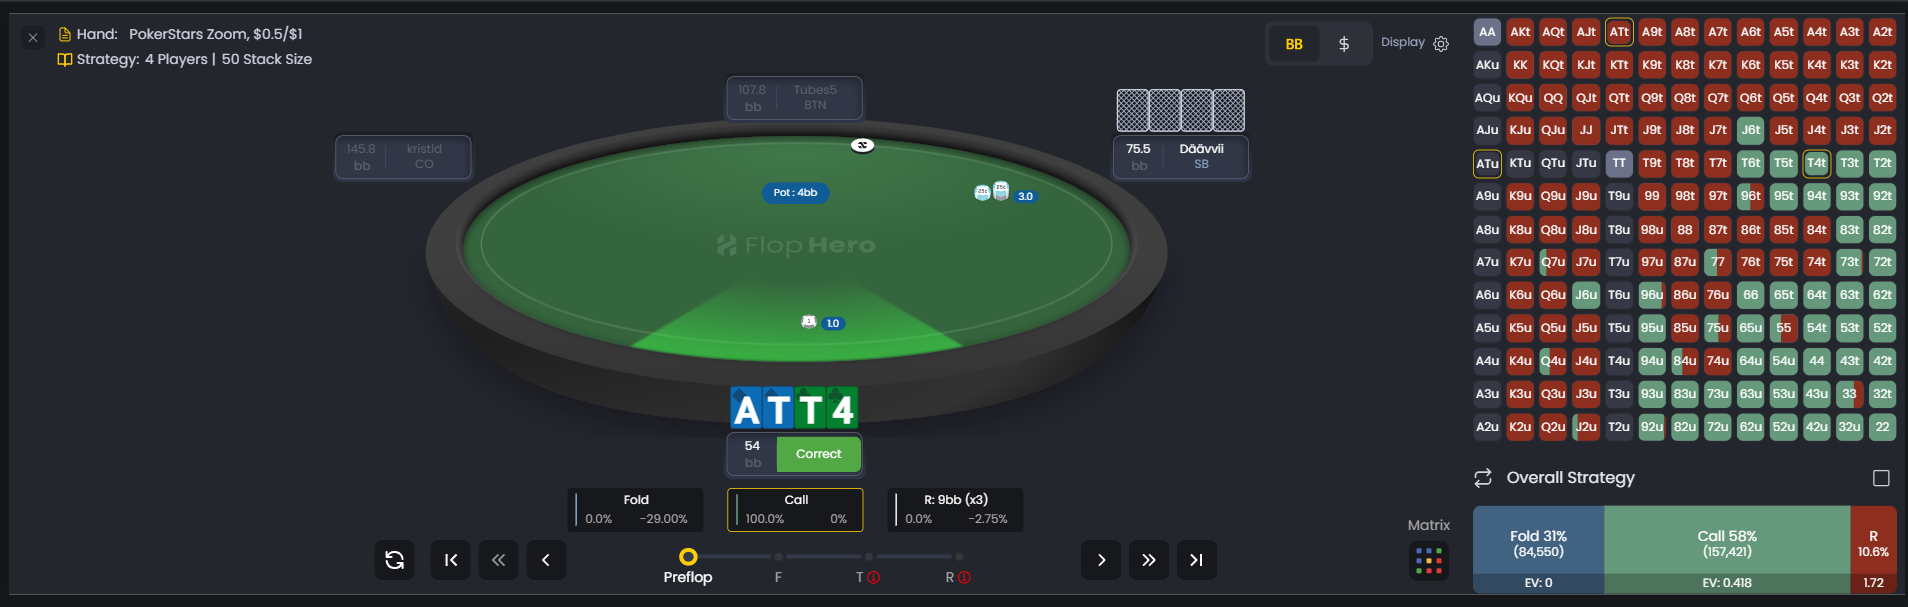
Use the street navigation buttons (P, F, T, R) at the bottom to jump to any decision point. At each street, you’ll see what action you took and what GTO recommends.
The platform shows you the optimal action frequencies and calculates the EV impact of your choice. If you folded when GTO says you should call 60% of the time, you’ll see how much EV you gave up.
On your right, you can also see and study the overall strategy for your entire range and not only the hand you played.
For a detailed walkthrough of all GTO Replayer features, check out our Replayer interface guide.
Reports page
Click the Reports tab (or the graph icon next to your session) to see a breakdown of your play by position and situation.
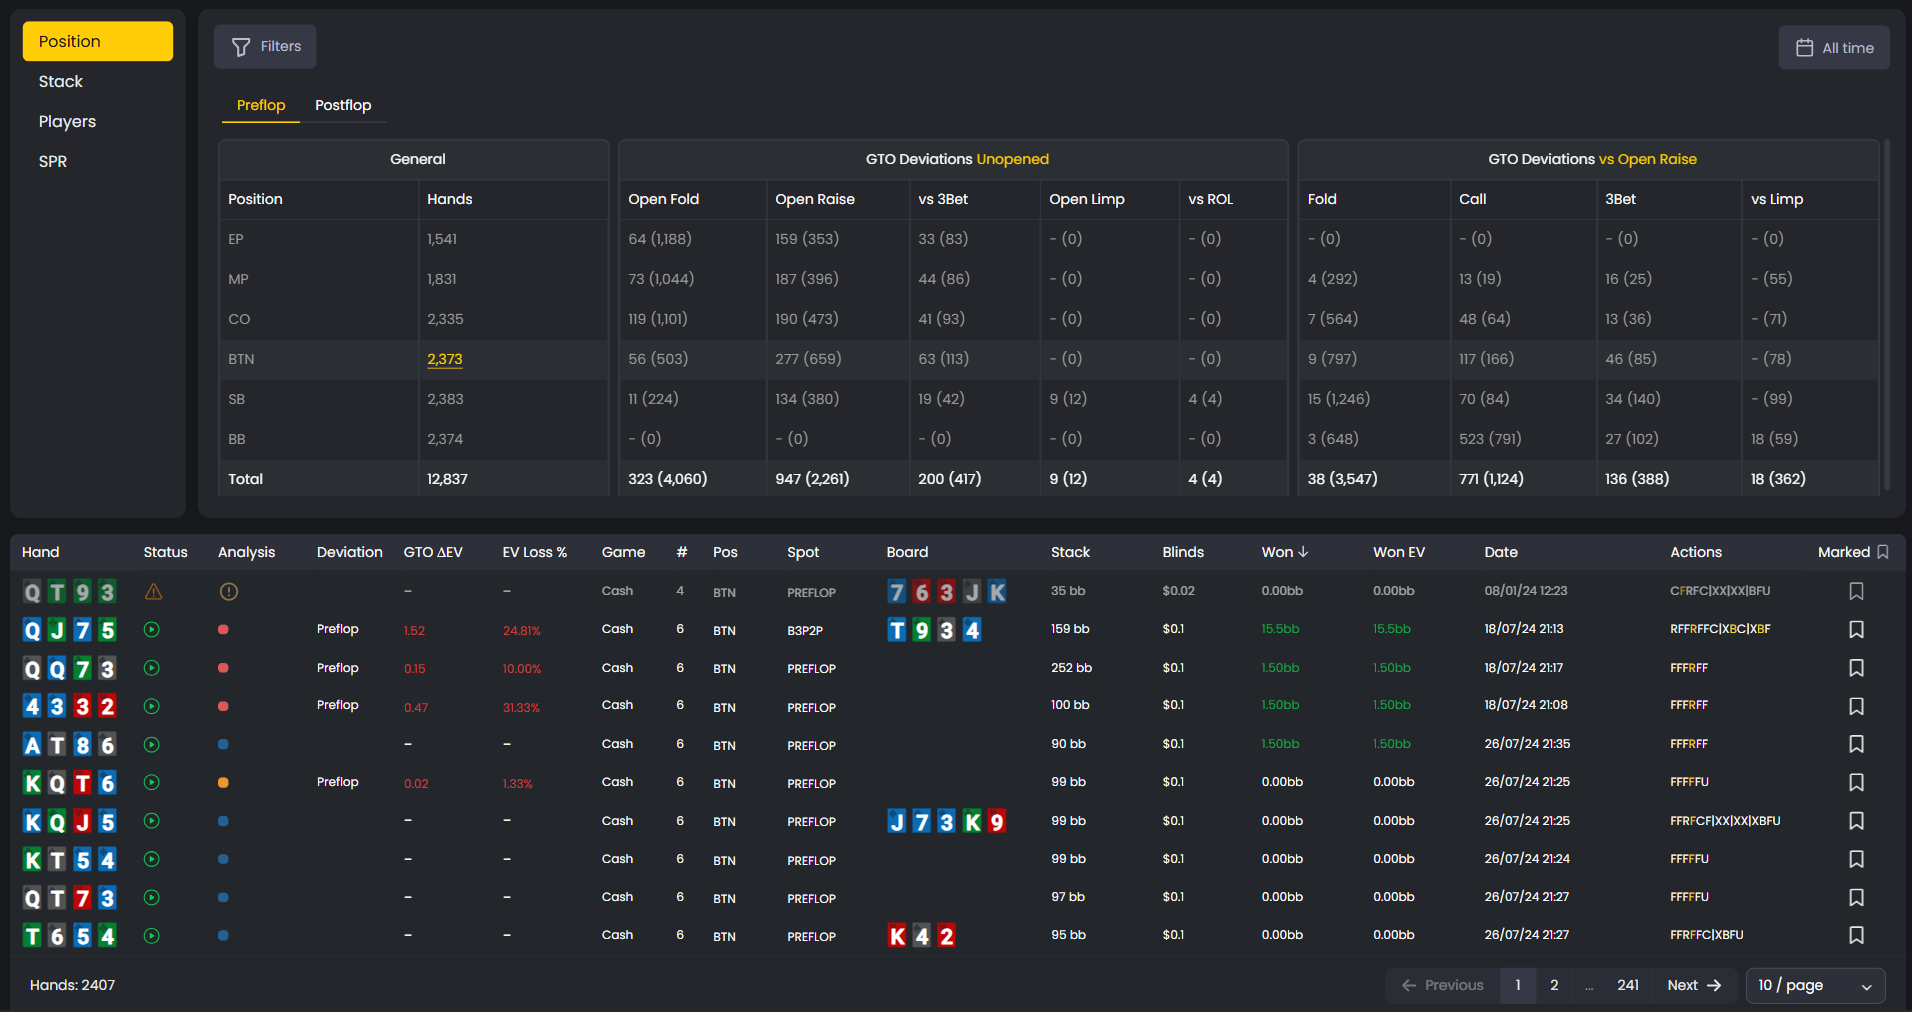
The Preflop tab shows three section side by side.
On the left, you see how many hands you played from each position.
In the middle, you see GTO Deviations for Unopened pots (Open Fold, Open Raise, vs 3Bet, Open Limp, vs ROL).
On the right, you see GTO Deviations vs Open Raise (Fold, Call, 3Bet, vs Limp).
The format “X (Y)” shows mistakes vs opportunities. For example, “20 (54)” means you made 20 mistakes out of 54 chances. That’s a 37% error rate.
The Postflop tab breaks down your play by street (Flop, Turn, River) and situation (vs CBet, vs Raise, etc.). Same format: deviations vs opportunities.
Use the Filters button to narrow down by stake, board texture, hand type and many more.
The date range button lets you analyze specific sessions or time periods.
Below the breakdown, you’ll see a list of individual hands with their deviation values. Click any hand to open it in the GTO Replayer.
For a complete guide to Reports and filters, check our article about types of reports.
What to focus on
Start with your biggest leaks. Sort your hand list by GTO ΔEV (highest to lowest) to see which mistakes cost you the most EV.
Open those hands in the GTO Replayer and figure out what you did wrong. Was it a preflop fold? A missed value bet? An overbet that should’ve been a check?
Once you’ve identified your biggest mistakes, head to the Strategies tab to study the optimal play for those spots. Use the Trainer to practice making better decisions.
Over time, your GTO ΔEV will decrease. You’ll stop making the same mistakes. Your results improve.
Was this article helpful?
Still need help?
Join our community
Get instant support from experts and fellow players
Join Discord Community